Welcome to the Climate Transition Map (CTM) interactive visualizations.
The new interactive version of the Climate Transition Map is now live!
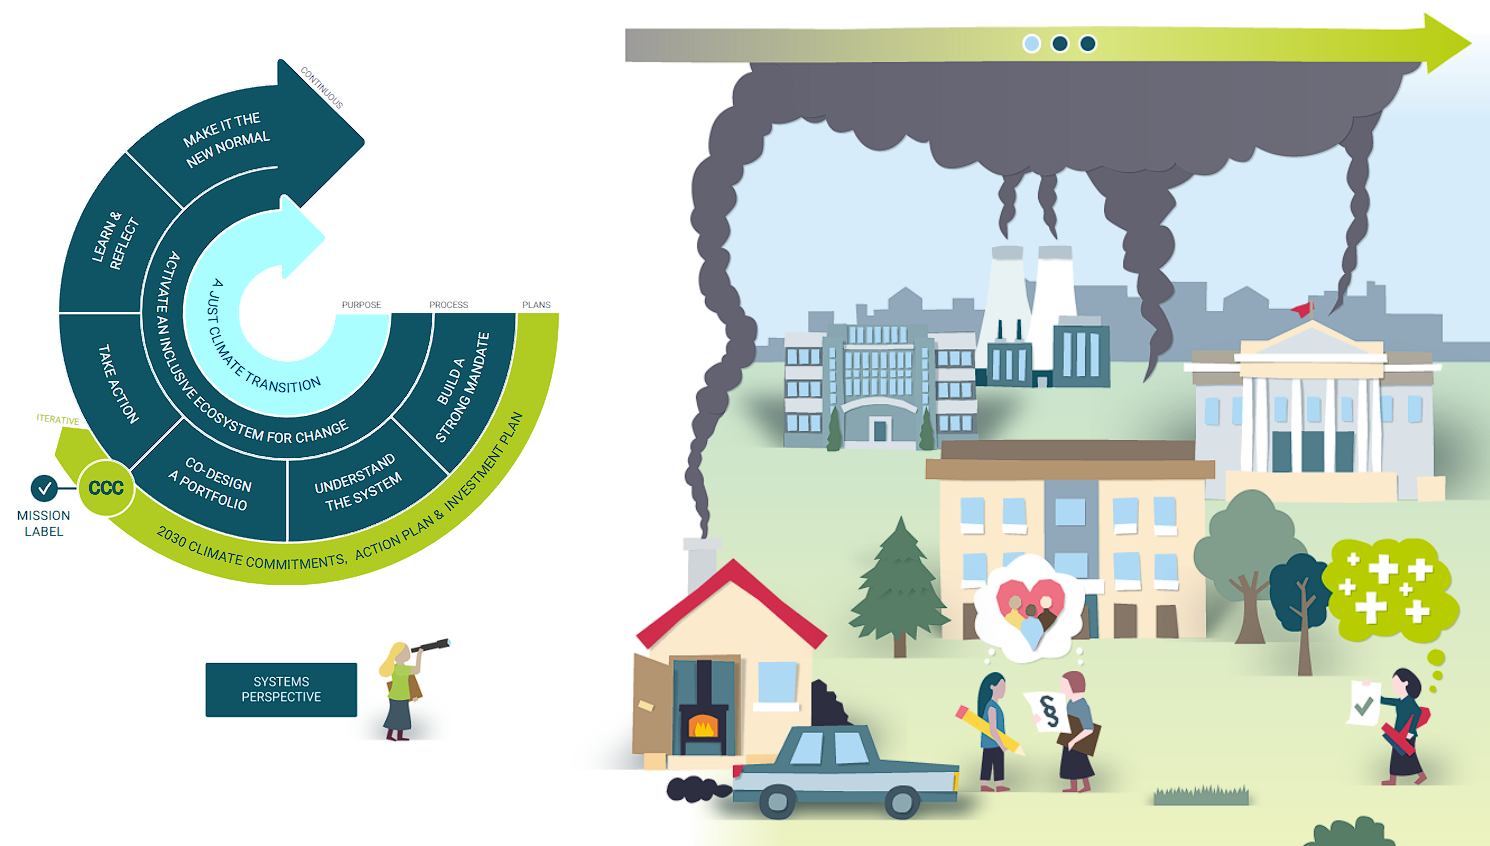
? Dive into the map to explore how the pathways connect and bring the climate transition journey to life. To view the full set, please click the image or enter this link.
For feedback or questions please contact: sophiaruizvasquez@systemssolutions.org