Welcome to the beta version 2 of the Climate Transition Map (CTM) and System Perspective interactive visualizations.
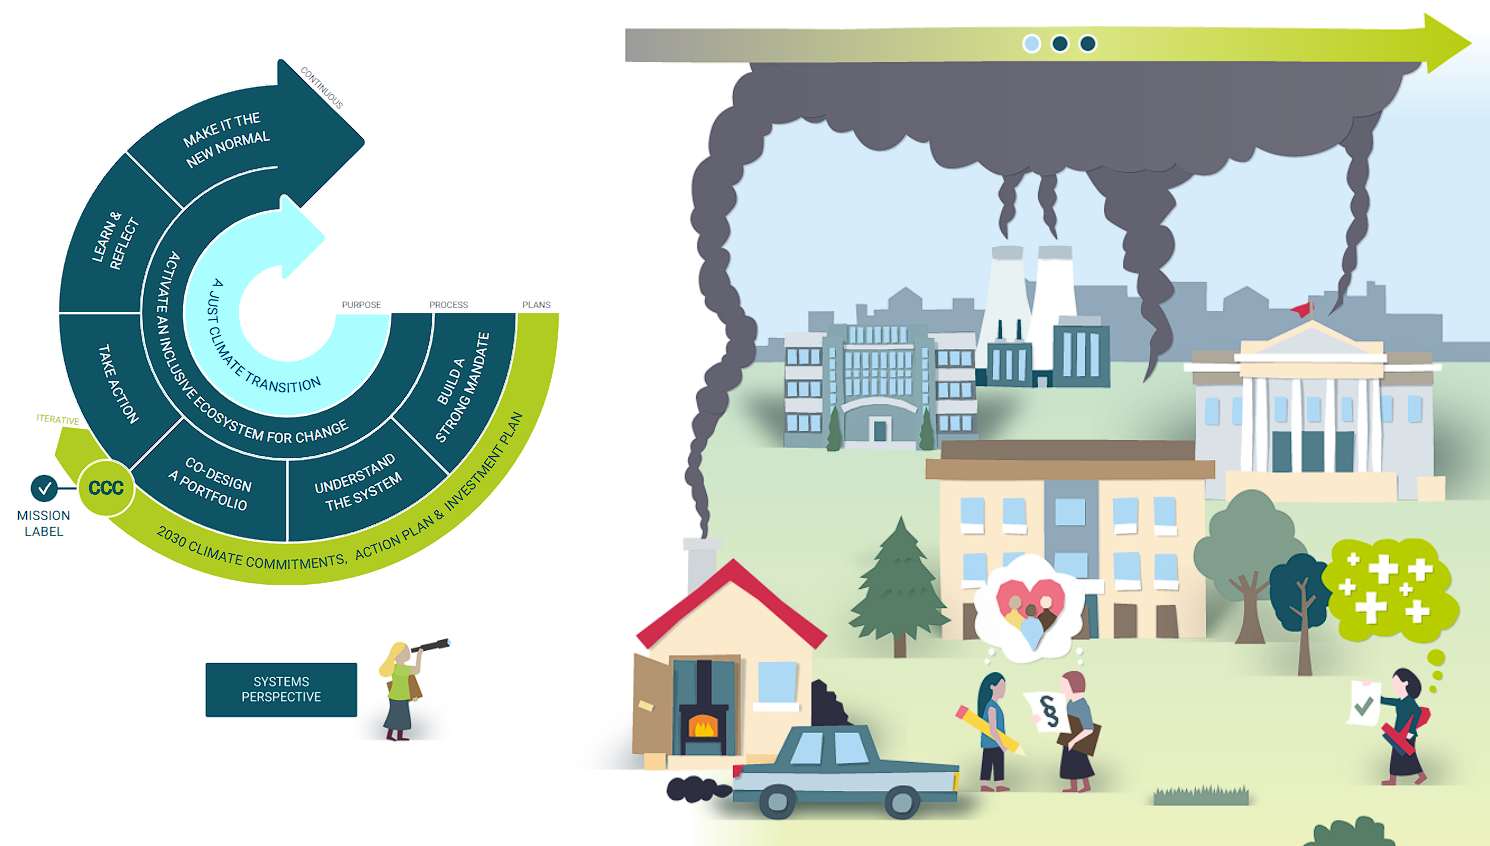
In this early-release experience, every stage of the Climate Transition Map (CTM) is fully clickable—click on any node to immediately preview its corresponding visual. Also, when selecting the "System Perspective" node the current visualization of the urban system from a systemic viewpoint will be displayed.
At present, only Step 1, “Build a strong mandate,” is fully functional. It features two interaction styles: clickable redirection links leading to relevant NZC tools, and dialogue bubbles offering conversational guidance. We’re running an A/B usability test—which is a standard practice for evaluating design effectiveness—to determine which model feels most intuitive . Once we analyze the feedback, we’ll integrate the preferred interaction style across all CTM steps and system-perspective visuals for a cohesive, interactive experience.
Feel free to click any stage to explore the visuals, and test both formats in Step 1. Your input during this beta phase will play a crucial role in shaping the final CTM user experience.
For feedback please contact: sophiaruizvasquez@systemssolutions.org
To view the full set, please click the image or enter the link